1c. What you can expect to achieve
With the building blocks from this course, you will be able to create any Flow you can imagine. Below is an example to spark your curiosity and inspire you how to use Kestra once you have completed this course.
Kestra's Flow Code Editor
Below is the Kestra Platform, with the feature rich Flow Code Editor on the left and the Topology diagram on the right. The Kestra Flow Code Editor provides syntax highlighting and autocomplete for the YAML Flow definitions as well as validation.
Syntax highlighting and autocomplete.
Example: Monitoring a website on a schedule (cron)
Here is an example of how to monitor a website on a schedule (cron) and raise a GitHub Issue (or send a Slack message) if there is an error; for example the status code returned is not the expected 200.
Flow creates a GitHub Issue when website unavailable.
GitHub Issue
This GitHub Issue with the label "bug" was created from the Kestra Flow above when an error on the website was detected. You can customise the title, description and labels to give you all the relevant information you would need to debug.
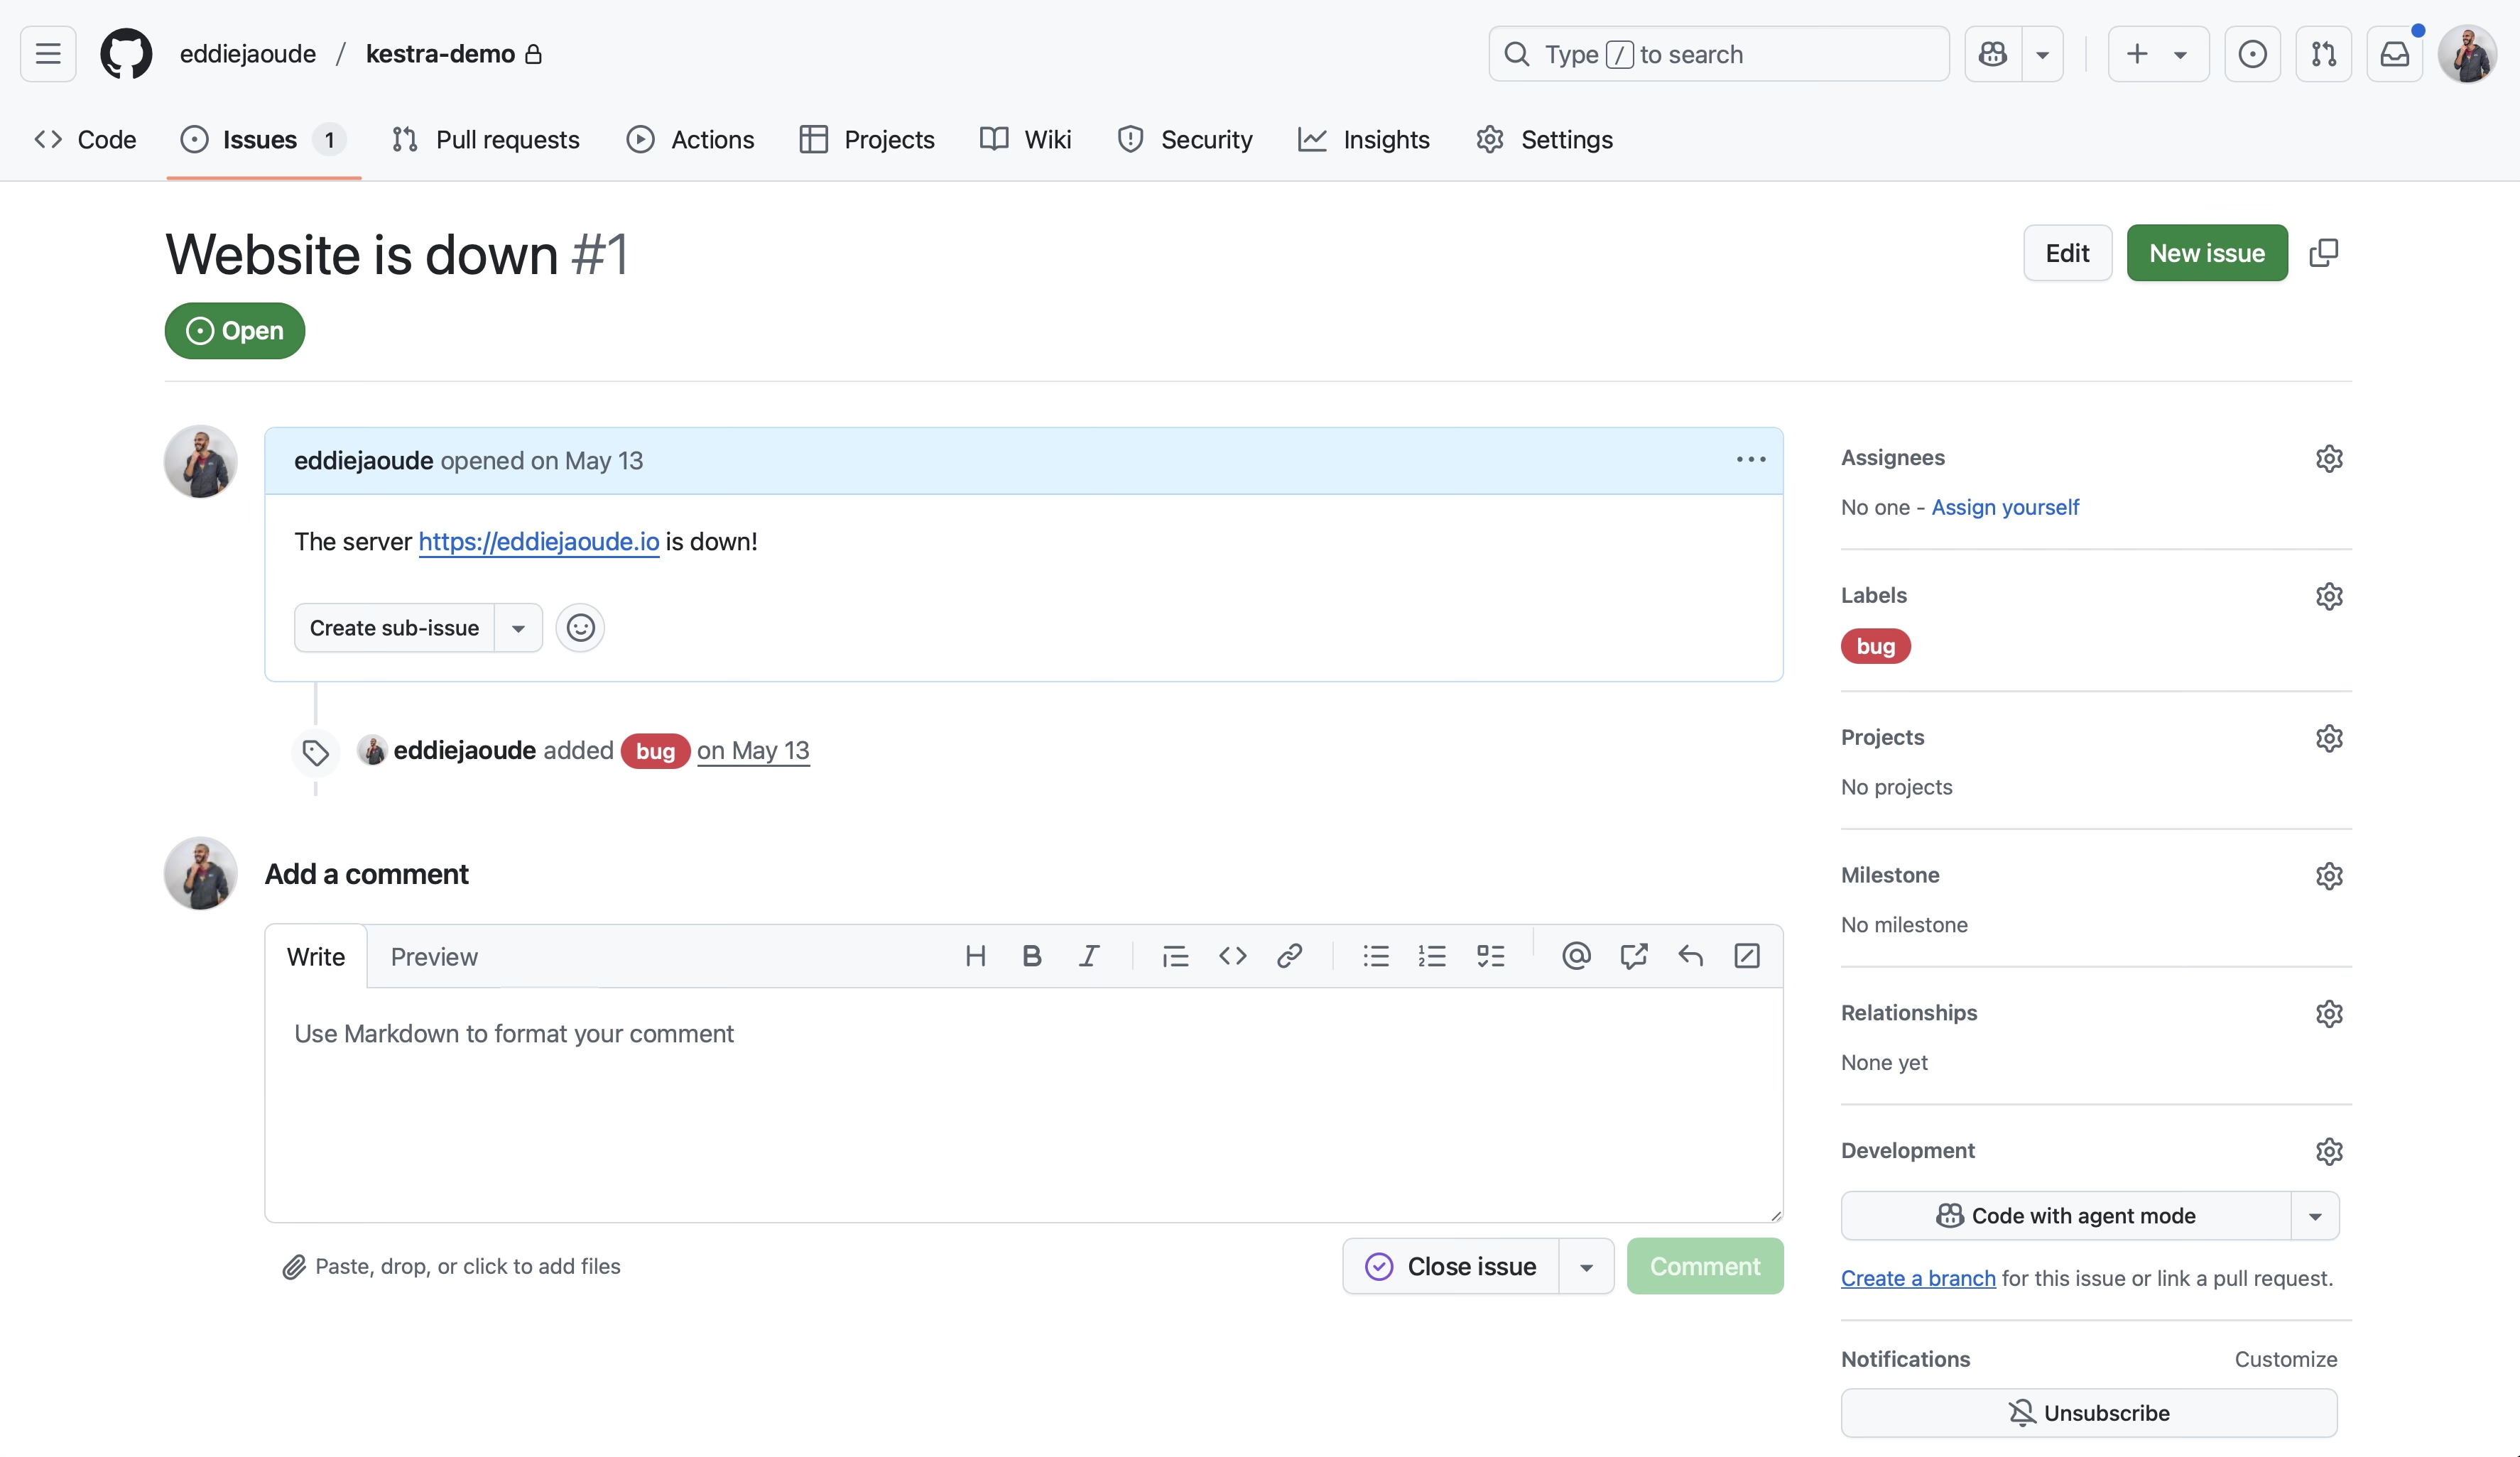
Kestra Flow created GitHub Issue.
Execution path
When viewing the historic execution, the Topology graph is the same as in the IDE above but it will highlight which path that Execution took. This is especially useful if there are multiple routes that could be executed and allows you to see clearly for this Execution how it got to the final result.
Topology diagram from the historic execution showing the path taken.
Naturally the above example may look daunting at this stage, which is perfectly normal. By the end of this course, you will know enough to build your own flows. You can also browse example flows in the Bonus section.
Tip: Join our Slack community.